Lab marker
eGFR
Estimated glomerular filtration rate
The standard estimate of kidney filtration, a quiet marker that drifts down with age and many longevity-relevant interventions.
What it measures
Estimated glomerular filtration rate, derived from serum creatinine plus age and sex (CKD-EPI 2021 equation, race-free). Reported as mL/min per 1.73 m² body surface area. The functional measure of kidney filtration capacity.
Reference context
4 guideline sources
eGFR alone underestimates kidney health; it should be interpreted alongside albuminuria (urine albumin-creatinine ratio). KDIGO stages by both filtration and albuminuria.
Population context: consult guideline targets below
Mechanism
Why moving this marker matters
GFR declines naturally ~0.5–1 mL/min per year after age 40. Faster decline indicates intrinsic kidney disease or systemic conditions (hypertension, diabetes, NSAIDs) accelerating the loss. CKD is independently associated with all-cause mortality.
Guideline targets
What major guidelines recommend
KDIGO (normal)
≥90 mL/min/1.73m²
KDIGO (mild decrease)
60–89 mL/min/1.73m²
KDIGO (CKD G3a)
45–59 mL/min/1.73m², clinical CKD
KDIGO (CKD G3b)
30–44 mL/min/1.73m², moderate CKD
How to measure
The test, where to get it, when to repeat
Method
Computed automatically from a standard creatinine test on most modern reports.
Where
Standard panels everywhere; included in routine GP bloods.
Typical cost
Bundled, €0 marginal.
Fasting
Not required
When to test
KDIGO 2024
40+Annual creatinine + eGFR for adults with diabetes, hypertension, or known CKD. Reasonable every 2–3 years for healthy adults from age 40.
USPSTF 2024
Insufficient evidence for routine CKD screening in asymptomatic adults without risk factors.
Where to test
Independent labs offering this test
Healicus refers you to independent laboratories. You order from the lab; they take the sample, run it, and return your result on their own platform. Healicus never sees your value.
Randox Health
UK · EU · INTLClinic-based premium panels — wider biomarker breadth than home-test brands.
Visit Randox Health
Synlab
DE · EU · INTLEurope-wide medical lab network — referrals via partner GPs and direct-to-consumer programmes where offered.
Visit Synlab
Medichecks
UKUKAS-accredited home blood-test panels with GP-equivalent biomarker coverage.
Visit Medichecks
Thriva
UKApp-first subscription home testing, capillary draw, clinician-reviewed reports.
Visit Thriva
Healicus is not the provider. Your contract for the service is with whoever you choose. Links labelled Sponsored are paid affiliate relationships; unlabelled links are editorial reference only. See our disclosure for the full policy.
Context
Reading the numbers
eGFR alone underestimates kidney health; it should be interpreted alongside albuminuria (urine albumin-creatinine ratio). KDIGO stages by both filtration and albuminuria.
Caveats
Creatinine-based eGFR is affected by muscle mass: very muscular adults can have spuriously low eGFR; very low muscle mass spuriously high. Cystatin C is the alternative when creatinine is unreliable.
Practices
What's been shown to influence this marker
PREDIMED-Kidney showed reduced CKD progression with sustained Mediterranean adherence; effect mediated through BP and glycaemic control.
DASH-style dietary patterns slow eGFR decline in adults with hypertension; effect via BP control.
 Habit
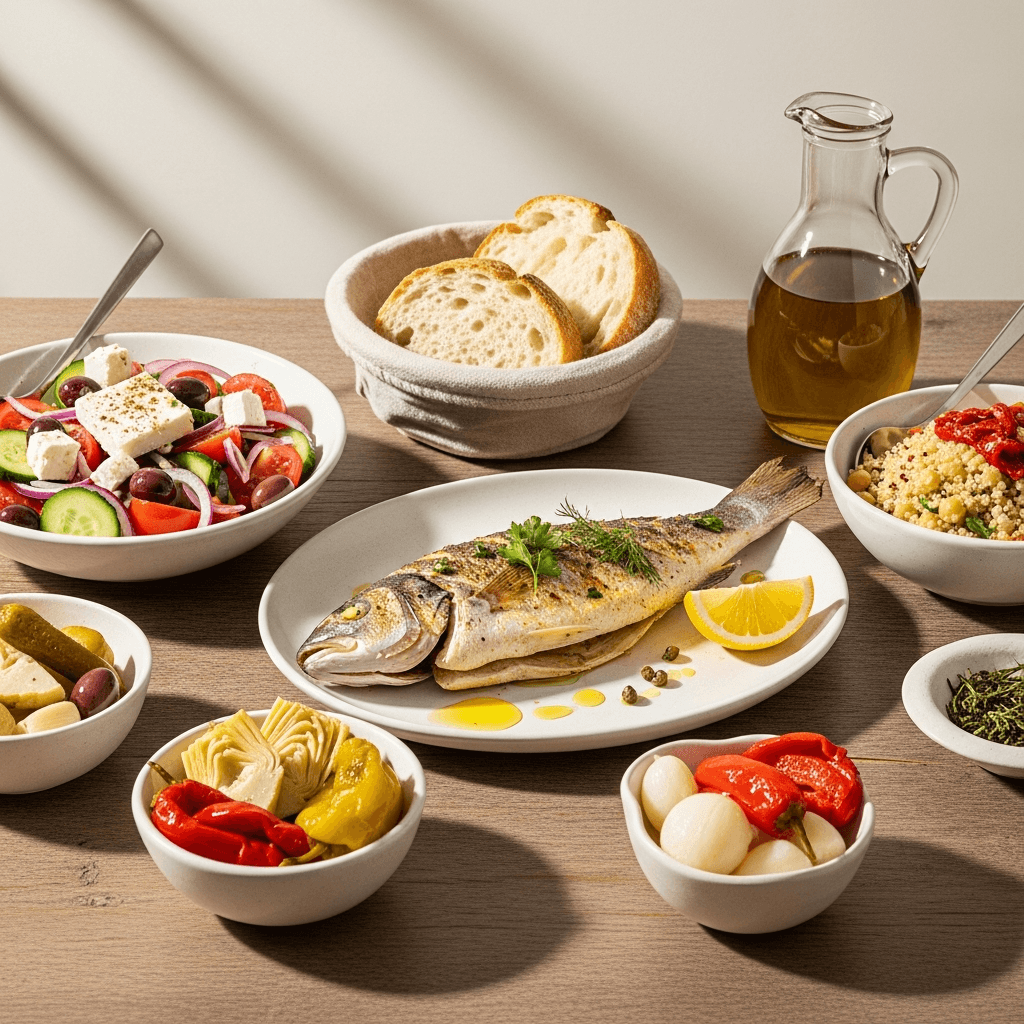
HabitMediterranean dietary pattern
Olive oil, fish, nuts, legumes, plants. The most-studied diet for cardiovascular and cognitive longevity.
Why
The Mediterranean pattern, heavy on plants, olive oil, fish, nuts, legumes; moderate fish and dairy; light on red meat, has the strongest evidence base of any specific diet for long-term cardiovascular and cognitive outcomes. PREDIMED, the largest trial, showed ~30% reduction in major cardiovascular events vs. low-fat control.
Slot in your day
How to do it
How
Olive oil as the primary fat. Plants at every meal. Fish 2–3× per week. Nuts daily (small handful). Red meat once a week or less. Wine optional, with food.
Sticking with it
Stock the kitchen for one week's pattern. Decisions live in the shopping list, not at mealtime.
Markers this may influence
Evidence
PREDIMED (Estruch 2018 NEJM, n=7,447, 4.8-y follow-up): a Mediterranean diet plus extra-virgin olive oil or mixed nuts vs. a low-fat control diet, ~30% reduction in major cardiovascular events (MI, stroke, CVD death). Sofi 2014 updated meta-analysis (n>4M) confirms a dose-response association with all-cause and cardiovascular mortality.
 Habit
HabitDASH dietary pattern
Dietary Approaches to Stop Hypertension. Strongest dietary RCT evidence for blood pressure reduction.
Why
DASH emphasises vegetables, fruits, whole grains, low-fat dairy, lean protein, and limited sodium, sweets, and saturated fat. The landmark NEJM trial (Sacks 2001, n=412) showed clinically meaningful BP reduction comparable to single-drug antihypertensive therapy in people with elevated BP. Combining DASH with sodium reduction is more effective than either alone.
Slot in your day
How to do it
How
Vegetables and fruits at every meal (~4-5 servings each per day). Whole grains over refined. Limit red meat, sweets, and sugar-sweetened drinks. Cap sodium at ~1,500-2,300 mg/day. Two weeks of consistent eating typically shows BP changes.
Ideal for
People with elevated or borderline blood pressure; cardiovascular prevention generally.
Markers this may influence
Evidence
Sacks 2001 NEJM DASH-Sodium RCT (n=412): DASH plus low sodium (~1,500 mg/day) lowered systolic BP by 11.5 mmHg in hypertensives and 7.1 mmHg in normotensives vs the high-sodium control diet, comparable in magnitude to single-drug antihypertensive therapy. Soltani 2020 meta-analysis (17 cohorts, n>1.2M) shows dose-response associations with all-cause and CVD mortality.
 CautionHabit
Limit alcohol intake
Lancet pooled analysis (n=599,912): lowest mortality risk threshold is ~100 g/week, about 5-6 standard drinks total.
Why
Wood et al. 2018 Lancet combined individual-participant data from 83 prospective studies (n=599,912 current drinkers in 19 high-income countries). Above ~100 g/week (about 5-6 UK standard units), all-cause mortality climbs in a dose-response manner. Below that threshold the curve is roughly flat, there is no protective effect. Reductions from heavier intake to ≤100 g/week could add up to 2 years of life expectancy at age 40.
How to do it
How
Track intake honestly for one week. If above threshold, set a weekly cap rather than a daily one (avoids the 'I'll catch up' trap). Several alcohol-free days per week is the simplest pattern. Sleep quality typically improves within 1-2 weeks of reduced intake.
Ideal for
Anyone currently drinking above ~100 g/week (≈one bottle of wine, six pints of beer, or a half-bottle of spirits).
Markers this may influence
Evidence
Wood 2018 Lancet pooled analysis (83 prospective studies, n=599,912 current drinkers across 19 high-income countries): the threshold for lowest all-cause mortality was ~100 g alcohol/week (≈5–6 UK units). Above that, intake is linearly associated with mortality and reduces life expectancy by 1–2 years at age 40 for 200–350 g/week drinkers.
 Habit
HabitZone 2 cardio
Conversational-pace cardio, 150+ minutes per week. Mitochondrial backbone of healthspan.
Why
Zone 2 is the intensity at which you can still hold a conversation but a song would be a stretch, roughly 60–70% of max heart rate. Sustained Zone 2 work increases mitochondrial density, improves fat oxidation, and is the single most consistently associated exercise input with all-cause mortality reduction in cohort studies.
Slot in your day
How to do it
How
Brisk walk, easy bike, slow jog. 30 minutes × 5 days, or 45–60 min × 3 days. The 'talk test' is the simplest gauge.
Ideal for
Anyone over 30; especially valuable as the foundation before adding higher-intensity work.
Sticking with it
Schedule it like a meeting. The session you 'fit in if there's time' is the session that doesn't happen.
Markers this may influence
Evidence
Lee 2012 Lancet Physical Activity Series (population-attributable risk analysis across >50 cohorts): physical inactivity caused ~9% of premature mortality worldwide, comparable to smoking and obesity. Kelly 2014 meta-analysis of walking and cycling (n=280,000 + n=187,000): each ~11 MET-h/week of either activity was associated with ~10–11% lower all-cause mortality.
See also
Related markers
Take to your physician
Worth discussing
- Whether your trend over multiple readings is stable or declining.
- If borderline, whether cystatin C measurement or albumin-creatinine ratio would clarify.
- Which medications affect renal function and how to monitor them.
Sources
Cited literature
- [1]KDIGO 2024 Clinical Practice Guideline for the Evaluation and Management of Chronic Kidney Disease(2024)
- [2]USPSTF 2024, Screening for chronic kidney disease in adults(2024)
- [3]Diaz-Lopez et al., PREDIMED: Mediterranean diet and incidence of CKD: a randomized trial(2019)
- [4]Chronic Kidney Disease Prognosis Consortium, Lancet 2010(2010)
Last reviewed May 2026
Keep reading